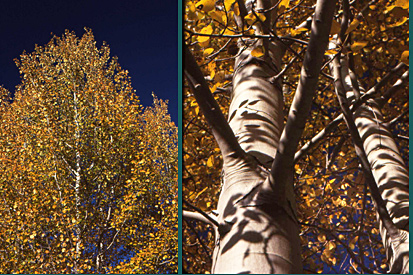
6 degrees in mid-September! Oregon doesn't wait very long to get mighty cold! The State's earliest single-digit low temperature occured in late summer at Seneca on September 14, 1970. Seneca is a small town north of Burns, in Eastern Oregon. (image above) The coldest areas of Oregon are often home to the delicate beauty of the Quaking Aspen tree. The specimens pictured above grow beside Mirror Pond in Bend, Oregon. The aspen tree (Populus tremuloides) is probably the most widespread tree in North America and is extraordinarily cold-proof, surviving even the bitter cold around the Arctic Circle in Alaska and Canada.
Nearly zero and September isn't even over. Seneca, September 28, 1931.... 1 above zero.
Sub-zero hits Oregon even before Halloween! Seneca, Oct. 21, 1996.... 2 below zero... and even colder and earlier at a small "Coop" station called Riverside 7 SSW, at a much earlier date.... 2 below, October 9, 1899...
November 1st. ushering in severe winter cold, 24 below zero.... this occurred at a small "Coop" (cooperative) station called Austin in the mountains east of John Day: November 1, 1936 (and read on below to see what happened in January of the 1936-37 Winter!). And don't neglect the 27 below zero reading seen on November 3rd. 1935 in the tiny village of "Lake," (the present-day location of the small town of Christmas Valley, near Fort Rock).
Earliest double-digit, sub-zero reading in Oregon in a real town in modern times: Seneca, Nov. 11, 2000... 11 below zero... And don't miss what happened in 1955 just four days later! See below
Mid-November ushers in Arctic conditions in Oregon! Ukiah, November 15, 1955.... 32 below zero, and Seneca at 31 below zero...... Also worth mentioning, but at a place that is not a town. Fremont 5NW (a ranch with a lengthy climate record), Nov. 15, 1955... 29 below zero. (click for more on Fremont). Also, Austin, November 15, 1955.... 29 below zero.
Frigid Thanksgiving! Seneca, Nov. 24, 1993..... 20 below zero. Many people were probably considering heading south when on Thanksgiving Day 1993 in Seneca the thermometer display read a frosty 20 below zero. (in the 1985 cold wave, Seneca hit a mighty 31 below zero a few days after Thanksgiving. And 'way back in 1931, the beginning of Seneca's weather records, 31 below zero was recorded on November 23, which is one very rock-hard-frozen Turkey!)
Icy times right before Christmas! Seneca, Dec. 22, 1990..... 36 below zero.... And at a site that is not a town, let's not neglect Fremont during the 1990 cold wave where 42 below was recorded on the first day of winter, 1990.
Worst Christmas ever in Oregon, and worst 3-day long cold wave in Oregon's history: Riverside, 1924: December 24 at 53 below zero, December 25 also at 53 below zero, followed by December 26 at 40 below zero! (Riverside 7 SSW, elevation 3380 feet, at the junction of the main Malheur River and the South Fork of the Malheur River. Riverside was a tiny hamlet with a post office (zip 97917) that began operation 1897, with records as recently as 2007; however, I cannot seem to find any recent information about it and its current status on modern maps or on the Internet! Please contact me immediately if you have further information, or, especially, an old or new photo to share!)
Oregon's all-time record low. Seneca, February 10, 1933.... 54 below zero (a full twenty degrees colder than the all-time record low for Minneapolis, Minnesota).... Note: there are just six places in Oregon where 50 below zero or colder have been recorded-- Seneca among them is the largest and most permanently inhabited. Oregon's UNOFFICIAL all-time record low, Paulina Lake, January 22, 1962... 60 below zero (click for more)..... 1989 is remembered as Oregon's most recent MAJOR MAJOR Arctic blast, approx February 2-17, Seneca hits 48 below, 45 below, and 42 below during the shocking cold wave, which lasted 15 days. There has been nothing of this depth or length ever since!
Another place trying to beat out Seneca.... Austin, January 1937..... 43 below on January 7, 52 below on January 8, and a second spate of extremity with 48 below on January 20 and 45 below on January 21. (there's more on the severe cold of 1937 further down this page).
CENTRAL OREGON'S COLDEST
CITY-- Please sit down,
it is MADRAS at 45 below
zero! While Madras is
usually considered much warmer in winter than Bend, occasionally,
in freak events, very cold arctic air can become entrapped in
its valley. This occurred three times in the early part of the
Twentieh century. 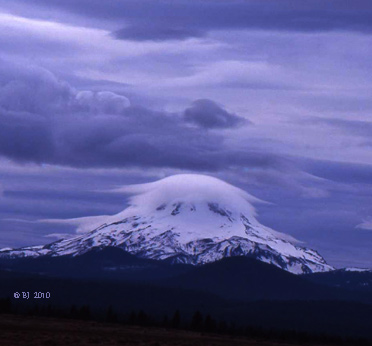 The
first time being in the massive early December cold wave of 1919,
where 45 below was recorded on December 12th at a predecessor
to the modern Madras station called Jefferson Plains......Then,
in 1924, right at Christmas time, another big arctic air stagnation
settled in, with December 24th tumbling to 40 below.... Six years
later, another bad one struck the town in January 1930, with January
21 bottoming out the twenty-day long cold wave with another 40
below zero reading (neither Bend nor Redmond has ever hit even
30 below)...
The
first time being in the massive early December cold wave of 1919,
where 45 below was recorded on December 12th at a predecessor
to the modern Madras station called Jefferson Plains......Then,
in 1924, right at Christmas time, another big arctic air stagnation
settled in, with December 24th tumbling to 40 below.... Six years
later, another bad one struck the town in January 1930, with January
21 bottoming out the twenty-day long cold wave with another 40
below zero reading (neither Bend nor Redmond has ever hit even
30 below)...
Coming in second place in Central Oregon is Prineville in its deep valley beside the Crooked River: 35 below zero on January 21, 1930.
Pictured to the left is a Lenticular-type cloud planted over the alpine summit of Mt. Jefferson. The thickening clouds higher above the peak show lenticular traces as well; earlier in the day, classic, floating lenticular clouds were seen in a mostly blue sky.... The picture was taken from near Madras, and shows clearly the manner in which the Cascade Mountains tend to block and obstruct clouds and winds arriving from the west (the Pacific). Your average person calls this structure simply "a cloud cap." Woe betide the climber who has one of these cloud caps suddenly form while he is high on the peak-- instantly whiteout conditions can create serious dangers-- cold, wind, and zero visibility for climbers trying to find their way off the mountain!
Oregon's longest string of sub-zero nights.... Halfway, 32 days with below-zero low temperatures, January 2 to February 2, 1949. Lowest recorded was 34 below, with an average low an amazing 16 degrees below zero (for comparison, the average daily low for early January in Fairbanks, Alaska is only a couple of degrees colder than this).. (Click for my description of Halfway, Oregon)..... And click again for a day by day description of the Halfway cold wave of December 1948-February 1949......At this point, we should mention that Seneca may have broken several cold records in either 1949 or 1950, but we will never know, because its weather station was closed in both of the record-breaking years 1949 and 1950, due to the health of its long-term observer Howard Lohf.....however, locals using the official station thermometer at Seneca reported to me that on Jan 31, 1950 it hit -50 in Seneca, which, if true, would constitute the most recent time it has hit 50 below zero in Oregon at an official station that is an actual town!).
Oregon's all-time lowest mean temperature months: 0.0 degrees F, January, 1937, Austin....or, choose the ranching station of Fremont 5NW, with a mean temperature for January 1990 of -1.4 degrees F (this is really cold, just two degrees warmer than Fairbanks, Alaska during February).
Most frigid 24 hour long period.... Austin, 1937, January 19 with a daytime high temperature of an aching 21 below zero, then falling to 48 below zero by the next morning!.... More recent such spell, Danner, in far southeastern Oregon, 1990: December 22 gets up to only 4 below zero, and the next day gets up to an even worse 10 below zero!
Coldest-Ever three-day spell in Oregon: Austin, January 19, 20, and 21, 1937..... (these are all records for the date still standing in Austin 72 years later)..... January 19, high of 21 below zero, January 20, high of 18 below zero, and January 21, high of 13 below zero..... January 20, low was 48 below zero, and January 21, low was 45 below zero.
Coldest-Ever four-day spell in Oregon: Riverside 1924 during the arctic blast that centered on Christmas Day, where the low hit 53 below on two consecutive nights. During the four days involved, the average low was 37 below and the average high a chilling 11.5 below zero.
Horrible ending to February... Austin, 1960. February 27 at 30 below, Feb. 28 at 28 below, and Feb. 29 at 22 below zero!
Biting first days of March.. Drewsey, east of Burns, March 1, 1993.... 19 below zero.....Or, much earlier in history, Fremont, 30 below zero on March 1, 1922 (click for more on Fremont)..... and among the stations that are true towns, Seneca of course weighs in with a wintery 26 below zero on March 5, 1939.
Pretty brutal mid-March: Riverside, March 16, 1906.... 17 below zero.
Shocking first day of spring: Seneca, March 22, 1952.... 11 below zero.... Even Worse, but not in a true town: Austin, March 26, 1913, at 19 below zero!
Nasty June morning, Fremont 5NW, June 3, 1931.... 10 degrees.
A town with no growing season at all: Chemult, on Hwy 97 south of Bend and Sunriver. There is not a single date on which the record low in Chemult is above freezing. In fact, the highest record low ever recorded in Chemult is still a hard frost at 28 degrees on July 26, 1949 (1937-the present). August 1, 1937 featured a bitter 19 degree morning!
Let's compete
with Death Valley
*...
JUNE 2021, MANY ALL-TIME RECORDS FALL. Portland hits 116,
Salem hits 117, The Dalles hits 118, Redmond hits 110 and Pendleton
hits 113.... Farther back in time, 1961, 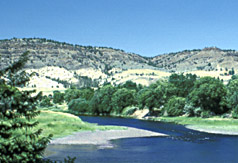 Spray,
on the John Day River, August 4, 1961....116 degrees (see
image). Pelton Dam on the Lower Deschutes River, August
4, 1998.... 117 degrees.... (Note: Oregon's all-time record
high is 119 degrees, set at both Pendleton and Prineville
in 1899-- weather instruments have only been in place at Pelton
Dam for a few decades, and I am certain that Pelton Dam will
exceed this record any year now, putting Oregon into the
exclusive class of States which have baked under temps of 120
degrees or more)
Spray,
on the John Day River, August 4, 1961....116 degrees (see
image). Pelton Dam on the Lower Deschutes River, August
4, 1998.... 117 degrees.... (Note: Oregon's all-time record
high is 119 degrees, set at both Pendleton and Prineville
in 1899-- weather instruments have only been in place at Pelton
Dam for a few decades, and I am certain that Pelton Dam will
exceed this record any year now, putting Oregon into the
exclusive class of States which have baked under temps of 120
degrees or more)
Oregon's hottest large city-- I award the title to Medford in Southwest Oregon, in the Rogue River Valley... Here are examples of its summer heat capabilities:
Summer 2017 despite the effects of heavy forest fire smoke, Medford featured 12 days of 100 or more, spread out over all four months of summer and many, many days in the upper 90s....May 24 breaking a record at 96 degrees, then June hitting 107 on the 24th. August hitting 112, 110 and 109, the 112 breaking the old record by a hefty seven degrees. Then early September soared to 105 and 102..The summer as a whole had very little relief from ongoing heat and warmer than normal nights, and heavy forest fire smoke smothered the area for several nasty weeks, holding down temperatures considerably, otherwise we would have seen highs to perhaps 115 or 116, and perhaps as many as 10 additional days exceeding 100..The Chetco fire was the main culprit, but there were many others fires in Southern Oregon, Northern California and even British Columbia contributing to the poor-to-terrible air quality.
Farther back in time, Medford on July 20, 1946, saw 115 degrees....Early August of 1981--.Four days in a row with highs of 110 or greater: August 7, 1981 high 111, August 8 with a high of 114, August 9 with high of 111, and August 10th with a high of 110 degrees!...And here is a more recent record-- July 23, 2006, high of 107, with a "low" of a balmy 74....In July of 1990, Medford toasted with 13 days of 100 degrees or more....September can still be very hot, ie. 110 degrees September 2, 1988..... Medford's climate has not only the strong summer heat, but also often basks under cloudless skies for weeks at a time during its long summers, the combination leaving Medford with much more in common with the "Mediterranean" climate of the Great Central Valley of California than the climate of the rest of Oregon-- I'm fond of saying that the Medford area is Oregon's little slice of California. Click for more about Mediterranean climates in the Northwest. (Also, see page bottom for a brief note about my nomination for "Hottest Large City" for the State of Washington).
Oregon Coast scorcher, recent-- Newport suffers with 99 degrees on August 13, 2002, destroying its previous record by well over 10 degrees. The Clackamas County Fair near Oregon City opens on that same day with 104 degrees, after a tropical nightime low of 70 degrees-- but a mere one week later Fair cleanup crews shiver in daytime HIGHS well UNDER 70 degrees!
September heat: Illahe, in Southwest Oregon, Sept. 3, 1955.... 111 degrees. (Medford suffered 110 degree heat in early September, 1988). See bottom of page for details on illahe.
Late September heat, Medford, 104 degrees, September 26, 1963. More recent-- Medford, 102 degrees, September 27, 2003.
Late-Season heat wave: Spray, a high of 100 degrees four days in a row, Sept. 26-29, 1963.
Even later-season heat wave: Powers, southwest coastal area, October 11-16, 1991, with highs of 103 degrees on the 11th, and 96 on the 16th! See bottom of page for details on Powers..... 2022: Up in the normally much-cooler Puget Sound, many of the cities, including Seattle, demolished old records with highs ranging from the mid-80s all the way up to 92; these highs were generally about 15 degrees hotter than the previous records for mid-October!.
Early Spring heat: Pelton Dam near Madras, April 3, 2000.....91 degrees. See Picture of the area, click here.
MAY---May Day withers: Pelton Dam near Madras, May 6, 1992.... 101 degrees.... Oregon's hottest Mays? 108 degrees, in 1986 at Pelton Dam, and 108 in 1924 in Blitzen (a tiny, now defunct pioneer town in far southeast Oregon which is also among the exclusive class of Arctic King towns of Oregon with 50 below zero, January 21, 1930).
Rose Festival Scorcher just days after very Gloomy Spring 2003---- Portland melting in four days in a row with temperatures well up into the 90s, June 4-7, 2003.
June-- record heat. The village of Blitzen in extreme southeastern Oregon recorded 113 degrees June 28, 1932 (and 50 below zero on January 21,1930, for a total historic temperature swing of 163 degrees, perhaps grabbing the record of "most extreme" for the State!).... For more on Blitzen, see previous paragraph about May records......Within a major town, the June record is probably Medford's mid-June heat wave of 1961, with 109 on June 15 and 107 on June 16--that was a very brutal way to begin a summer (I lived in Medford at the time and still remember my bike tires squishing through nearly molten asphalt on the streets)!
NEVER A TRULY COOL MONTH IN OREGON---There's never been a month in Oregon when you couldn't go somewhere and encounter 80 degree heat!...But such mid-winter warmth can occur in wildly different settings, eg. the all-time record-high for Oregon in January is Fremont in Central Oregon's arid Fort Rock Valley with 82 degrees (January, 1934); however, this tiny place suffers enormous daily ranges of temperature, and it is likely that the day it was 82 it was well below freezing in the morning! -----On the other hand, Oregon's other zone where mid-winter warmth occurs is truly a "Banana Belt." This zone occurs for some 50-60 miles along the remote Southern Oregon Coast; its prime exemplar is the town of Brookings, on the extreme southern Oregon coast, which is blessed with the "The Brookings Effect." This warmth-creating weather mechanism is present year-round, but especially notable during the winter months. Brookings is truly named "Home of Winter Flowers," and the area is a huge producer of Easter Lily bulbs.
More on the Brookings Effect--- This unique weather effect was first described by Portland weatherman Jack Capell (see end of paragraph) in the mid-1950s. It produces heat records like these-- Brookings, January 28, 1984. 80 degrees, and in nearby Port Orford, 80 degrees on December 15, 1988 (Port Orford is 50 miles north of Brookings). And warmer yet by mid-February, when Brookings has hit a very summery 83 degrees (February 19, 1988).... Special note: the Brookings Effect often occurs within days of Eastern Oregon suffering intense sub-zero cold snaps, which makes the Effect all the more remarkable, but since the heat is restricted to this tiny and remote section of Oregon's coast, its existence is a real surprise to most of Oregon's rain-chilled residents...... Jack Capell Commemoration: Mr. Capell was a hero of mine when I was a teenager, a major influence in the development of my life-long interest in weather and climate. He worked for KGW TV in Portland until his retirement in 2000. He passed away in June 2009 at the age of 86. He was KGW's first-ever TV Weatherman! Thank you, Jack.
New Research --- I have posted new research which I have completed on the Brookings Effect on a page of its own.... it conclusively shows that the so-called Brookings Effect is a highly capricious beast that does not offer a complete explanation of how and why some of the coastal towns in this area of Oregon (all the way up to Newport) sometimes get toasted by temperatures very near to 100 degrees. The research also broadens the geographical scope of the Brookings Effect to a zone at least 50 miles to the north of Brookings, and will note the occurences of Brookings Effect heat waves that in fact miss Brookings itself ..... Also, please see below for more on the Brookings Effect:
The Brookings Effect is a complex phenomenon, not fully understood; it's not simply warm California thermal low air moving up the California Coast that produces it, eg. Crescent City and Eureka, CA usually are either missed or have much less of the "Effect" than Brookings. A key factor in the effect is the unique topography of mountains around Brookings, especially the Chetco River and Cape Blanco, all of which interact with Brookings' unusual south-facing shoreline to produce down-canyon hot dry winds. The Brookings effect is definitely at its peak only in the limited zone around Port Orford, Gold Beach, and Brookings, but something related seems involved in the extraordinary late-season heat that can blast the inland villages of Powers and illahe (see below)!
Details on illahe and Powers: two tiny towns lost in the remoteness of the Southern Oregon coastal mountains, both of which hold some of Oregon's heat records.
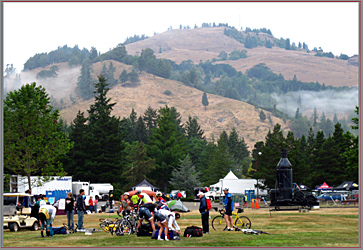
Powers lies at 285 ft. elevation about 22 air miles due east of Floras Lake State Park, famed for its cranberry bogs. Powers has nearby Myrtle wood forests, being somewhat shielded from the cool coastal airs by mountains 1,000 to 2,000 ft. high. The town lies in a narrow valley beside the clear flow of the South Fork of the Coquille River. It's climate and vegetation show strongly that sometimes the hot/dry suns of interior Southwestern Oregon prevail in a really remarkable fashion-- while at other times cool coastal mists and low clouds also prevail. The picture below was taken in late summer 2011, at the Powers County Park, and shows this climatic mixture quite well. Click here for additional details about the 1991 coastal heat wave that set Oregon's all-time October record..... Picture credit: C. Pratt
illahe is a tiny town deep in the rugged canyon of the scenic Rogue River, 33 river miles up from the mouth of the river near Gold Beach. illahe is well-known to Rogue River Wild River jet boaters and receives it's U.S. Mail via jet boat. The village is just 17 air miles over the Agness Pass (2,358 ft.) from Powers, and sheltered from the coastal air by mountains up to about 4,000 ft. It is in Curry County, whereas Powers is in Coos County....OSU Press prints a captivating book about Illahe, "Illahe, The Story of Settlement in the Rogue River Canyon," 264 pages, by Kay Atwood.
Be sure to read the startling results of new research I have completed on the Brookings Effect.... In part it will be shown that this tiny southwestern coastal area of Oregon is truly a major exemplar of "Oregon, a State of Extremes" (George Taylor's phrase).
* NEW WORLD RECORD? With all due deference to other hot spots, the real Death Valley, which is deep in the Southern California desert is, by some measures, truly the hottest place in the world during it summer months. On August 16, 2020, Furnace Creek Visitor Center in the Valley recorded a verified 130 degrees, which is likely the hottest fully-verified temperature ever recorded in World!.......Here are some other recent examples: late June 2017-- about a solid week where daily highs were 120 or more, including two days at 125 and one at 127 June 24, 2017..... July 21, 2003 with a high of 125, and a low of 99, followed on July 22 by a high of 122 and a low of 102. Yes, you read that correctly-- Death Valley is one of the only places in the world where night-time temps. sometimes do not go below 100 degrees! And this was very true during the extreme heat waves of 2017, where for two consecutive nights, the lows were 102 and 103 degrees!... And on July 18, 2005, with a high of 129 degrees, and a "low" of 98 degrees! And again in summer 2006, another day set a new record for "highest minimum for the date" when the daily low fell to only 102, bringing the notice of the national media, proclaiming it another sure sign of global warming.
*WASHINGTON--- Notes about heat in Oregon's northward neighbor--- My nomination for Washington's hottest larger city has got to be Tri-Cities (Pasco, Kennewick, Richland). This hotbox lies In south central Washington along the mighty Columbia River and very close to the Oregon border. Recent example of record-setting heat: July 23, 2006, with a high of 112 degrees, and an average temperature for the day of an Arizona-like 90 degrees (Tri-City normals for the date are 95 high and 61 low ). Comparison values--- Seattle's normal high for the date is nearly 20 degrees cooler, a mild 76, with a normal low of 56.... Tri-Cities is a very fertile agricultural area, well-irrigated and justly famous for the abundance of warm weather crops it produces, such as watermelons and corn!
SPRING 2008 GLOOM. THIS IS HOW BAD THE CLIMATE CAN BE.......Cold/Gloomy Spring 2008 in Oregon/Washington-March 1 to June 11-- so far June 2008 in Olympia has produced ZERO clear days, ZERO partly cloudy days. .. Much more depressing, there have been only FOUR clear days for the entire period of March 1 through June 11. Temperatures have also been lousy-- June temperatures so far have been very cold for June, with only one daytime high making it out of the 50s. At 3 p.m. on June 11 in Olympia it is just 52 degrees with chilly winds....At Sea-Tac June 5th reached only 54 degrees on a dark, rainy day, and June 9th topped out at only 55 degrees, again on a dark and rainy day. Below are telling road cam images from just over the border in Oregon on the morning of June 10th. Most of the United States on the 10th was suffering under various regional heat waves; meanwhile, in the Oregon/Washington mountains, it was a very wintery scene on June 10th. The first image is from the major InterState route over the Blue Mountains, and the second is from the major route between Portland, Oregon and the whole Central Oregon area; you will note that snowfall is reaching down to winter-like low elevations:
The rest of Summer 2008? Long-range forecasts are predicting generally more of the same for Summer 2008.
1. As mentioned above, Halfway holds an Oregon record for the longest string of sub-zero nights. This 32-day record is very little-known and was discovered in the course of this author's historical weather record research. It is a record that applies to "real towns where people live," not remote recording stations, isolated ranches, or the like. At its worst, Halfway was down to 34 below zero in this prolonged cold wave (January 25, 1949).
2. The even less-known record that Halfway holds also occurred during the same brutal winter of 1948-49. Many experts say this winter ranks among the top five "coldest ever" winters to strike Oregon in historic times.
I call the record, "Oregon's longest string of arctic weather in a real town." It hit Halfway, Oregon, December 16, 1948 through February 2, 1949. (a spell of 49 days, which is easy to remember because it ended in 1949!).
December 15,
1948 had a chilly night, 7 above zero, but things were to get
much, much worse.
Dec. 16, the morning temperature slid to 1 above zero, the point
at which I arbitrarily mark the beginning of the Longest Arctic
Period in Oregon's recorded History.
Dec. 17, the long string of sub-zero nights began in earnest with
a 12 below zero reading on the town's thermometer.
Dec. 18, colder yet at 17 below zero.
Dec. 19, a brief warm-up, Halfway's data is "missing"
this date, but nearby stations allow me to estimate 1 below at
Halfway.
Dec. 20. A real warm-up, 7 above zero, and it seems like the brief
pre-Christmas cold spell is about to end in time for Christmas
festivities.
Dec. 21 back down to 7 below zero.
Dec. 22 . Yikes, 14 below.
Dec. 23. Now the day dawns at 24 below and residents are beginning
to take this cold wave seriously.
Dec. 24. It sinks to 28 below zero and Christmas preparations
are slowing down to molasses in the bitter cold.
Dec. 25. Still 22 below zero.
Dec. 26. Still 21 below zero. It's now been basically ten days
of bad cold, and residents are beginning to forget the brief warm-up.
Dec. 27. At 14 below, the thick ice on all the rivers, streams,
stock ponds continues to grow day by day.
Dec. 28, only 5 below zero and hope begins.
Dec. 29, only 1 below zero and now hope blossoms.
Dec. 30, it's up to 1 above zero this morning! Now hope is big although of course nothing at all is melting!
December 31, down to 1 below.
January 1, 1949. It's New Year's, and we know it's finally over! The morning temperature springs up to a mild 11 above zero. It's been 16 days of nasty cold, and we're more than ready for it to be over!
January 2, we wake up to 16 below zero, and know that things have taken a bad turn again.
January 3, with the morning at 25 below zero, moods are dismal around town.
January 4, the morning is at 30 below zero, the coldest it's been and most believe it can't possibly get any colder than this! Modern comparison: the all-time record coldest for January 4th in Boston, MA is only 4 below zero, and only 17 below in Denver!
January 5, tiny relief, only 22 below zero.
January 6, up to 8 below.
January 7, up to only 5 below and maybe cautious residents can afford some hope.
January 8, down again, this time to 11 below.
January 9, terrible cold again, 30 below zero.
January 10, worse, 31 below zero, the coldest yet, will this ever end?
January 11, 1949. Another night of 31 below zero. This is unbelievable. The cold wave has now been going on for 27 days, nearly a month!
January 12, at 25 below zero, this is what some weathermen like to call "54 degrees of frost."
January 13, paralyzing cold continues at 22 below zero.
January 14, still at 21 below zero.
January 15, is a warm spell coming? It's only 13 below this morning!
(January 16-24 data will be posted later)
January 25, THE COLDEST YET. 34 BELOW ZERO.
January 26- February 12th data will be posted later.
February 13, it's a bitter 19 below zero this morning, and 30 below is reported at Austin in the Blue Mountains east of John Day (Seneca's temperatures are unknown due to it's station being out of operation this entire winter)
-- to be continued
copyright 2008-2022 by Bruce B. Johnson, all rights reserved.