For context, here are Washington State's Rainfall records: Wettest year on record, 1931, with 185 inches, set at Wynoochee Oxbow*. Driest year on record was 1930 (amazingly, just one year previous to the wettest), with a scanty 2.61 inches, set at Wahluke** in Eastern Wasington. (* elev. 562 ft, about 25 miles NNW of Aberdeen, see spot on map below marked "19.2") (** Wahluke is elev. 425 ft, 38 miles NNW of Kennewick, on the Columbia River)
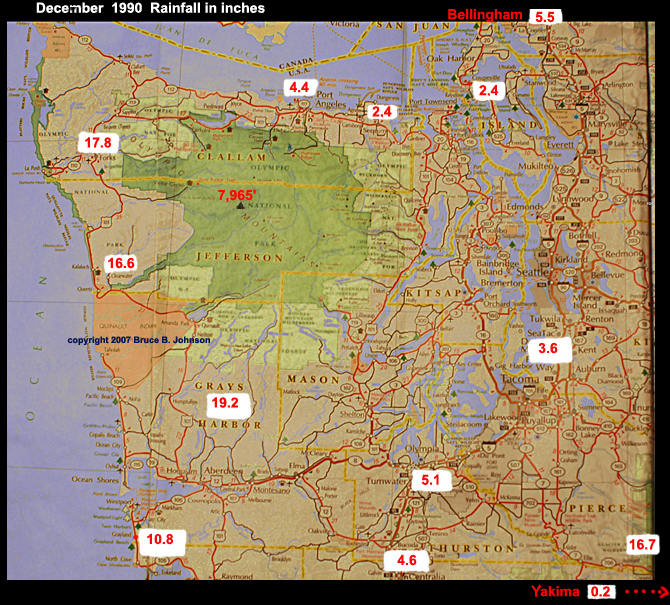
The graphic that I have created below is meant to be representative of the general winter rainfall patterns around Western Washington. To this end, I happened to choose December of 1990. It was a December marked by a severe cold wave during the last week of the month. Rainfall-wise, it was somewhat sub-normal, but there was variability along a generally north-south pattern, with Bellingham in the far north actually slightly above normal, while the Southern Sound around Olympia had a fairly severe moisture deficit. Further discussion is found beneath the graphic.
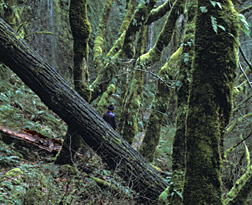 Although many tend to think of all
of Western Washington as a damp green rainforest, the truth is
rather different. There are great variations. Most are traceable
to the huge mass of the Olympic Mountain range, a massif with
peaks up to nearly 8,000 feet, lying directly in the path of the
normal storm track, like a giant wall. Since the majority of rain-bearing
storms, and especially the wettest ones, tend to attack the region
from the SW, one notes a strong Rain Shadow effect on the
NE side of the Olympics. On the graphic, one notes an eight-fold
decrease in rainfall as one takes a direct SW line across from
Sequim (2.4 inches) to Clearwater (16.6 inches), an airline distance
of only 80 miles.
Although many tend to think of all
of Western Washington as a damp green rainforest, the truth is
rather different. There are great variations. Most are traceable
to the huge mass of the Olympic Mountain range, a massif with
peaks up to nearly 8,000 feet, lying directly in the path of the
normal storm track, like a giant wall. Since the majority of rain-bearing
storms, and especially the wettest ones, tend to attack the region
from the SW, one notes a strong Rain Shadow effect on the
NE side of the Olympics. On the graphic, one notes an eight-fold
decrease in rainfall as one takes a direct SW line across from
Sequim (2.4 inches) to Clearwater (16.6 inches), an airline distance
of only 80 miles.
Areas in the most extreme part of this rain shadow receive only about 16 to 20 inches of rainfall per year, only half of what the Seattle/Tacoma area receives! This driest area centers around Sequim, which appears to be the driest town in all of Western Washington, with a bare 16 inches of yearly rainfall. For years, pilots have called the Sequim area "The Blue Hole" due to its tendency to have relatively clearer skies than areas to the east and west of it.... The rain shadow extends out onto the nearby islands somewhat, eg. to Coupeville with just under 21 inches, and to Anacortes in the San Juan Islands, with just over 26 inches. The rain shadow definitely extends west from Sequim to Port Angeles, although the latter is up to 25.6" of yearly rainfall.... On the eastern shores of Puget Sound the rainfall increases, the driest site I could locate being Mt. Vernon at 32.3 inches. The main Seattle area has several recording sites, and they vary between about 35 and 37 inches per year (despite the fact that Seattle has a reputation as a very wet West Coast city, the Sound's wettest large city is a lot wetter than Seattle- it's Olympia, with over 52 inches of annual rainfall). Seattle's reputation as very wet owes in part to the prevalence of grimly dark, damply overcast days in the winter months and, in the summer, to long periods of dry, but overcast skies.
Why doesn't the Sequim Rain Shadow area look like a desert?
To the casual traveler's eyes, these deeply rain-shadowed areas around Sequim do not appear as dry as they actually are. There are at least four major reasons: 1. Since the entire region is at a relatively high latitude (about 48 degrees), the intensity of solar radiation is low enough that evaporation and other desertifying processes are relatively weak.. .2 Despite the big reduction of rainfall in the rain-shadowed zones, there is only a modest increase in clear skies and sunshine, which remain near the low annual levels which afflict all of Western Washington... 3. Although yearly rainfall decreases to only 16-20 inches in the driest zones, it is still not dry enough to change the basic vegetation very much, especially once one factors in the protective effects of the damp and fairly sunless climate.... 4. the Sequim area in particular has a strong tendency to collect summertime fogs, which hold its average daily highs to barely over 70 degrees even in midsummer; these fogs reduce sunshine, increase humidity values, and decrease any summertime evaporation. In fact, the fogs often are thick enough to actually water the vegetation through a process of dew collection, like the coastal deserts of Peru. These four reasons go a long way toward explaining why the 16 inches of rainfall in Sequim does not succeed in making the area look very dry. (Peruvian Coastal Deserts, Atacama Desert, Peru)
For reasons such as those quoted
above, the main trees of Western Washington continue to be seen,
even though the area's climate is near their limits in terms of
dryness...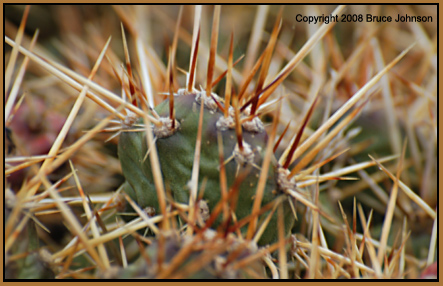 This
having been said, the discerning visitor can note some significant
vegetation changes; chiefly, dry-area plants such as Garry oaks and grasslands can be seen. Although you can find some
very nice wild
flowers here, it can be very difficult to grow certain plants
and flowers in your garden. If you want to enjoy some flowers
or plants from out of the region, you may want to try having those
plants
delivered instead of trying to grow them yourself..These vegetation
types (eg. Garry Oaks) really cannot survive in the wetter areas
of Western Washington, but around Sequim the relative dryness
allows them to get by, despite the lack of the heat and dry air
that they prefer.
This
having been said, the discerning visitor can note some significant
vegetation changes; chiefly, dry-area plants such as Garry oaks and grasslands can be seen. Although you can find some
very nice wild
flowers here, it can be very difficult to grow certain plants
and flowers in your garden. If you want to enjoy some flowers
or plants from out of the region, you may want to try having those
plants
delivered instead of trying to grow them yourself..These vegetation
types (eg. Garry Oaks) really cannot survive in the wetter areas
of Western Washington, but around Sequim the relative dryness
allows them to get by, despite the lack of the heat and dry air
that they prefer.
One correspondent claimed to me that there even existed native cacti around Sequim... This was such an amazing claim that I made a special trip to the area, and, indeed, her evidence was incontrovertible! (see image from Nov. 2009)...These cacti are a tiny prickly pear cactus (opuntia fragilis). They were reported to be in some abundance by the the first white settlers to the area, so if they are not native, it is truly difficult to explain how else they got to the Sequim area! Since Sequim's average daily high temperature in even the warmest month is only 72 degrees, these must be some pretty cold-adapted cacti! My image doesn't give the viewer a sense of scale, but these are LITTLE, they struggle to get by, it is amazing to me how adaptable cacti can be (my image covers a tiny area, only a bit over two inches long).
The Southern Puget Sound area is routinely wetter than the mid-Sound area around Tacoma and Seattle. What is occurring in places such as Olympia is that the typically SW track of the major storms has a direct line to Olympia, basically unimpeded by Olympic rain-shadow effects. In my graphic above, December 1990 was a significantly subnormal month in the Olympia area. The average for December is actually well over 8 inches, not the 5.1 inches that fell in December 1990.... Shelton, about 15 miles NW of Olympia, is even wetter, averaging about 66 inches of rain per year.
For a very recent example of the Sequim rain shadow in action, please click for this graphic (below).
Yakima Valley Rain Shadow--
Here's an example of a rain shadow that has created a region that
looks very deserty!
As one ascends up the
Cascades onto Mt. Rainier, rainfall increases at Paradise Lodge
(5,500 ft) to levels as high as the low-lying areas on the western
slopes of the Olympics, but then drops off rapidly into an
extreme rain shadow on the east side of the Cascades, particularly
extreme behind the massive bulks of Mt. Rainier and Mt. Adams.
This is where the Yakima Valley lies. Descending off the wet and
heavily-forested crest of the Cascades, even the casual traveler
will note the very obvious and radical alterations in the vegetation
as they drive toward the Yakima Valley-- in this, quite unlike
the much more subtle rain shadow around Sequim (see above)....
In December 1990 the city of Yakima saw a meagar 0.2 inches of
rainfall, less than a tenth as much as Sequim, the driest location
in Western Washington (see graphic at page top) ). And unlike
areas like Sequim, the Yakima area is not only dry, but also experiences
a great deal of sunshine and clear skies, creating a harsh climate
where even oak trees have trouble surviving without additional
water. The actual long-term precipitation averages give the Yakima-Sunnyside-Wapato
area a scanty 7 to 8 inches of rain per year. That is really dry,
but with ample irrigation, the Yakima Valley is a prolific commerical
grower of vegetables and fruits, and with several vinyards!
Mt. Shasta area rain shadow, as reported by my friend Todd C. ... Mt Shasta is an enormous bulk rising to over 14,000 feet. Given it sheer size, one would expect some rain shadow effects on its leeward side and some major orographic uplift rain on its windward side. Todd reports that Mt Shasta City on the southwest side receives about 40 inches of rain annually, while parts of the rather uninhabited northeast side receive only about 4 inches per year. This is a rather extreme rain shadow effect, but approximately of the same magnitude as what you can witness in Central Oregon, where the trip from the summit of Santiam Pass out east to the city of Redmond will show the same ten-fold decrease in precipitation: from about 80 inches at the Pass to only 8 inches at Redmond!
Copyright 2007-2025 by Bruce B.
Johnson
OregonPhotos.com
Please Quote Author and/or obtain permission before using
Sequim Theory: The Rain Shadow effect
around Sequim/Port Angeles is at its maximum strength when rain
events like so-called Pineapple Expresses hit Western Washington.
This is because those storms are carried into the area on southerly
winds. Winds from this direction seem to interact with the Olympic
Mountains in such a way that much of their rainfall potential
is lost by the time areas like Sequim and Port Angeles are reached.
A recent record-setting Pineapple Express is cited to illustrate.
All four stations are sea level stations alongside the Puget Sound...:
The result of 23% for Seattle Downtown seems a bit anomalous,
but Sea-Tac airport data about 15 miles south show that the winds
on Jan. 6-7 were from the SSW, perhaps enough from the SW that
a maximum rain shadow effect was achieved in Seattle Downtown.
January 6,
2009.
The rain hits, with winds from the south, hitting Olympia hardest.
January 7, rainfall is at its maxium all over the Puget
Sound area; winds are still from the south.
-------------- January 6... January 7.... Total....... Percent comparison
Olympia.. .... 1.32"........ 4.82"......... 6.14"....... 100%
Seattle city.. 0.28"........ 1.13"........ 1.41".......... 23%
Port Angeles 0.75"....... 1.10"........ 1.85".......... 30%
Sequim......... 0.55"...... 1.02"...... . 1.57".... ...... 26%
Yearly Comparison:
On an annual basis the difference in rainfall between Olympia
and Sequim is about 53.4 inches vs. about 16 inches, which is
29%. Generally, one could say that Sequim receives less than
a third as much annual rainfall as Olympia does...
Probably the small % difference between 26% and 29% (see chart)
is either not statistically significant, or it indicates that
Sequim is not as well-shielded from rain when storms come from
other directions (eg. up the Strait of Juan de Fuca).
Copyright 2009-2026
by Bruce B. Johnson MA
All Rights Reserved
Please Quote Author and/or obtain permission before using.